After ditching my car a few years ago because I live in an urban area and do not need one for my daily life, I began walking more frequently for transportation. As happens, I noticed how dangerously people were driving. That’s nothing new in itself. Every time I checked the news, it seemed another person was killed while walking or biking. I’ve had countless close calls, been buzzed, and been reversed into while using a marked crosswalk with the pedestrian light on. The way I heard reporters and the general public talk about crashes was bothersome, between calling them “accidents” or rushing to blame the pedestrian. In late 2019, I decided that in the new year I would start mapping where these deaths were occuring, and maybe this would help illustrate how much of an issue this was and that there were patterns.
Occasionally people have asked that I make a specific kind of map for them, and then I never hear from them about it again. Are they using it? I have no idea. It costs my time and my personal peace, so I decided to modify material to be what I think is more useful.
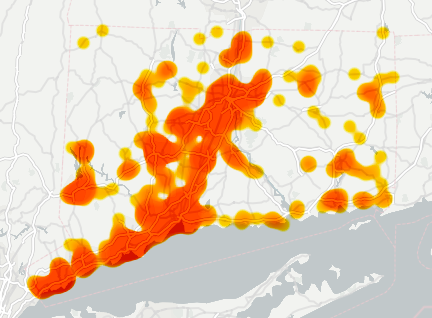
What this meant was taking a heat map showing where pedestrians and cyclists were killed since 2020, when I began tracking this, and adding in data going back to January 2015.
Adding to a map as poor street and vehicle design claims more victims is not the same as adding in hundreds of entries in the course of a few weeks. There are ways to automate this. It does not feel right to completely hand over to technology what amounts to a representation of someone’s life lost.
I recently finished* this and from the process reconfirmed some obvious known facts, and came upon a few other trends. I’m sharing these observations to add context to the heat map in the hopes that readers will badger their elected officials and decision makers until these folks act.
- Pedestrians and cyclists get killed where there are no sidewalks, or where sidewalks are on only one side of the road. This is not new information, and the State’s Complete Streets directive even pushed hard for creation of more sidewalks for exactly this reason. If you don’t give people a place to be away from fast-moving cars, they die. To be more blunt, those who designed these roads this way, those who fight sidewalks, and those who don’t budget for sidewalks effectively kill pedestrians.
- Multi-lane roads are deadly. There is more potential for obstructed views, and in off-peak hours when the road is not congested, reckless drivers can more easily achieve dangerous speeds. The wider road takes longer for people to cross on foot. It’s hard for everyone, but especially for those over 55. Four people died from contaminated eyedrops and the CDC issued a massive recall. There have been days when as many people are killed in motor vehicle crashes on our roads in just Connecticut, and no similar measures are taken.
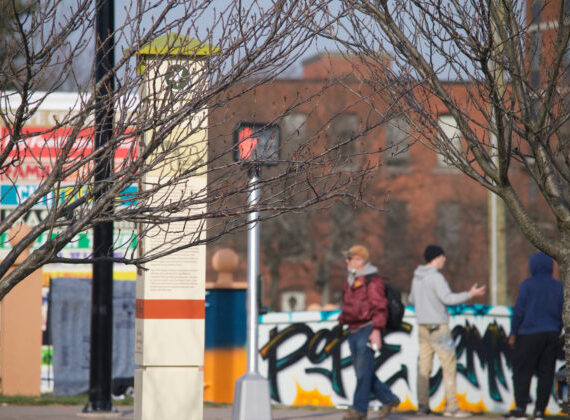
- Crosswalks help. They are not magical. For a crosswalk to improve safety, it needs to be where people want to cross the road. The paint needs to be fresh — many fatal crashes happened where stripes were very faded, and definitely not visible at night. They also can’t just be paint. Hi-vis signs telling drivers to yield to pedestrians help, but also only to an extent. When these are posted on high speed, multi-lane roads, not a whole lot is achieved. Having an exclusive pedestrian crossing phase helps, yet not so much if walkers have long waits to get this light or if drivers are allowed to make right turns when their light is red. The experts know what safer road design looks like. This is not a national secret. We don’t need endless street audits; we need action.
- Zero thought is given to location of bus stops. In many, many crashes where the news reported that the pedestrian was not in a crosswalk, it turned out that the person had exited a bus and was crossing the street from the stop. Bus stops are not usually placed at intersections where crosswalks are painted because of the fear that they will slow down drivers. This design asks pedestrians to backtrack or otherwise make nonsensical detours in order to cross the road legally. This is an equity issue. Drivers are not consistently told to make five minute loops to achieve what could be done in thirty seconds. Our current design and system largely does not value pedestrians’ time or lives.
- Rural mailboxes are a problem. On roads that are designed well and have sidewalks, it is less of a concern for someone to cross the street to collect their bills. These are often on roads where people drive too fast, there is insufficient street lighting, and there is no sidewalk or an inadequate shoulder. Multiple older Connecticut residents were killed in recent years while checking their mailboxes. Attention needs to be given to correcting these roads to get drivers to go slower, but in the meantime, mailboxes should be moved to the same side as the person’s house.
- Younger adults get killed on highways. As I plugged in the information about a person’s last moments, reduced to data points, I began noticing how if the victim was 18-45, they were much more likely to be killed on a highway than other kind of road. While older adults struggled to safely cross any kind of road, it’s the younger (and beginning of middle aged) adults who are struggling to stay alive when their vehicle breaks down. A lot of these crashes happened when a motorist was either in an otherwise minor crash or has car trouble, so exits the disabled vehicle wherever it seemed safest on highways that often have little physical space for stopped vehicles. Sometimes the victim was standing in a place that, to be honest, seemed not very smart; however, if we look at these situations with compassion, we can understand that when someone is in a high stress situation, they are not always thinking clearly. Why not structure are spaces to be more forgiving, but installing rumble strips between travel lanes and breakdown lanes, and have ample space between those two? Why not look at highways that lack any breakdown lane and address this? Vehicles break down. Vehicles crash. Instead of acting like this is not an issue, accommodate it, even and especially if that means removing a travel lane to create a breakdown lane.Other times, though, the person was standing off the roadway, and still ended up getting hit because another driver veered into the wrong lane hitting the stopped car and sending that crashing into the pedestrian. People who almost exclusively drive are not thinking of themselves as pedestrians, but this was a common pedestrian crash scenario that has not received enough attention. Rather than admonish drivers to slow down, it makes sense to evaluate the design: is there ample breakdown lane space, is there a rumble strip and one that has enough space between it and a parked vehicle, is the white line reflective, is there adequate street lighting?There are some pedestrian crashes on highways that are not connected to disabled vehicles, and they seem related to the big thing nobody wants to talk about: suicide. Although I don’t know how much the suicide prevention signs help on train platforms, railroads acknowledge that this is why most train-pedestrian collisions happen. When pedestrians are killed on highways and there is no vehicle reported nearby or any other obvious reason for a person to be crossing there, you have to ask if this was intentional on the victim’s part, and if so, what else could have been done to save that person’s life. This is not as easily solved through design; it’s not something to ignore, either.
- Children get killed in driveways. Despite all the helicopter parenting and forbidding kids to enjoy the freedom of cycling and walking places on their own, kids are still getting killed. Specifically, young children are dying in residential driveways. This is based on what is found in the Connecticut Crash Data Repository, which does not include all pedestrian fatalities on private properties. Of the kids (0-12) killed by vehicles as pedestrians/cyclists, seven times out of twelve, the child was in a private, residential driveway. Children are generally not darting into traffic, actually. One was killed while standing on the sidewalk; a driver was fleeing police, hit another vehicle, and the force of that sent the vehicle into several pedestrians on the sidewalk. Another child was killed while crossing a road, struck by a vehicle that had just been involved in a car-vs-car crash. One child was standing next to parked cars, with family, watching a July fireworks display when struck. One child was killed while crossing to/from an ice cream truck; the driver of another vehicle was going too fast and decided to pass the truck. Those were the exceptions. The rest were in driveways. All but one of the fatal driveway strikes involved large vehicles. I define large vehicle as anything bigger than a sedan. Reporters spare no details about “hit and runs” and crashes involving stolen vehicles, but suddenly they forget how to report facts when negligent driving and poor vehicle design kills a child in a home driveway. This can be done without increasing harm to the child’s survivors, and it is more responsible to name the right names: what types of vehicles were involved. Knowing how incredibly deadly large vehicles are to small children, adults might begin acting like it and rethink what they choose to purchase and drive.
These are the vehicles that have been involved with mapped child pedestrian deaths:- 2 Jeep Wranglers (SUV)
- Jeep LCF (SUV)
- Toyota 4Runner (SUV)
- Kia Telluride Ex (SUV)
- Ford Econoline (van)
- Chevy Express (van)
- Chrysler Town & Country (minivan)
- Ford F-150 (pickup)
- Ram 1500 St (pickup)
- Acura 3.2 TL (sedan)
- Buick Lacrosse (sedan)
- Honda Accord (sedan)
- Large vehicles are as much of a problem as you’ve read about nationally. Connecticut residents seem to believe we are the exception to national trends, but we aren’t. I don’t know how many times the vehicle involved in a fatal pedestrian collision was a Chevy Silverado or Ford F250, but it was a lot. While people get their knickers in a twist over reckless ATV and motorcycle operators, these were responsible for extremely few pedestrian deaths in Connecticut — fewer than five since 2015.
In creating this heat map, I consulted the Connecticut Crash Data Repository, any existing news coverage on the collision, obituaries and funeral fundraiser pages, and importantly, Google Maps.
What the Google Street View car manages to capture is incredibly telling. For instance, when looking up the site of a fatal crash in Waterbury in August 2019, I was able to see that this portion of North Main Street near Brewster Street has a history of disrespecting pedestrian space. How? In May 2019, this view was captured:
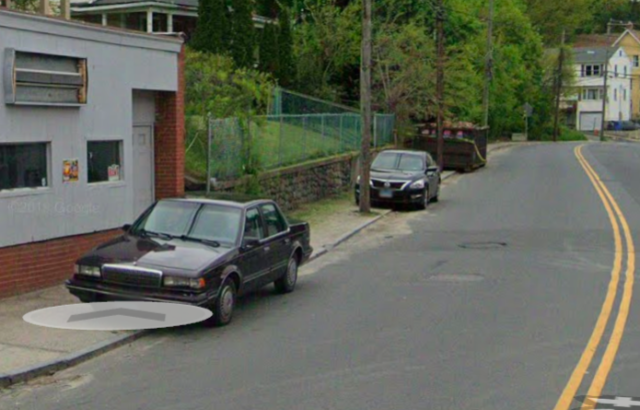
You can see two vehicles and a dumpster blocking all or part of the sidewalk.
I know someone reading this wants to explain the legitimacy of this obstructed walkway, or give the benefit of the doubt. Don’t.
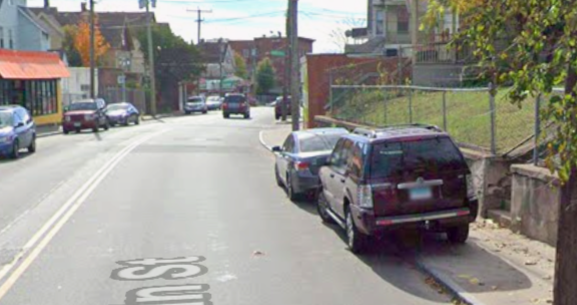
Here’s that same place in October 2016, looking from the other direction:
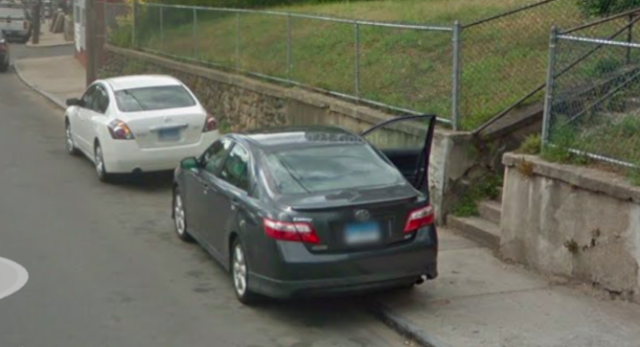
And most maddening, is that Waterbury does not seem to care that someone was killed here, because in October 2020, after the fatal pedestrian crash, people were still blocking the sidewalk with their cars:
Also October 2020, but on the next block:
You take an area with inadequate street lighting and turn the other way when people routinely store their private property across sidewalks, and what you get are people walking in a dark street.
That was not by any means the only time I encountered photographic evidence of continued negligence.
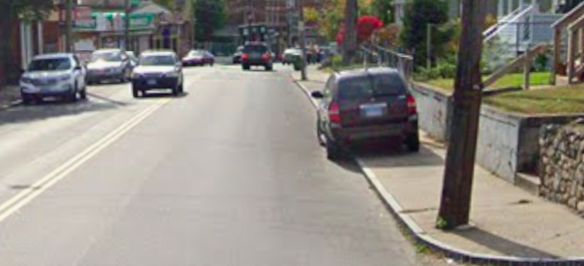
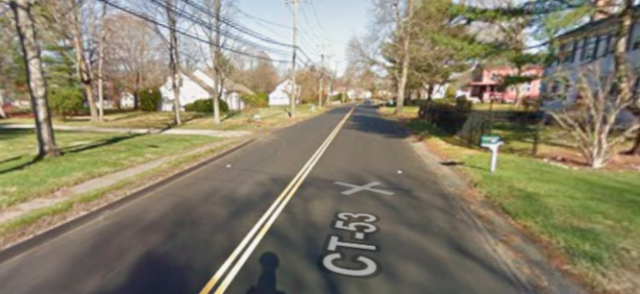
Looking at the site of a fatal crash on Route 53 in Norwalk near a group home, you can see how in December 2015 — four months before the crash — there was no sidewalk on one side of the road, and what appears to be unmaintained sidewalk on the other side.
Here is what the same area looked like in September 2016, five months after the 79-year old pedestrian was killed:
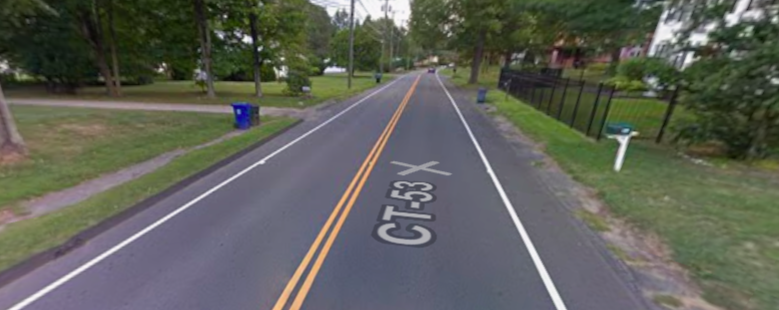
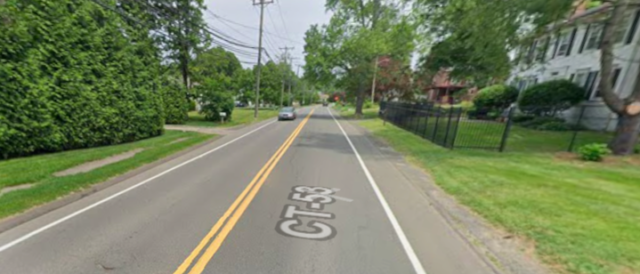
And again, in June 2023:
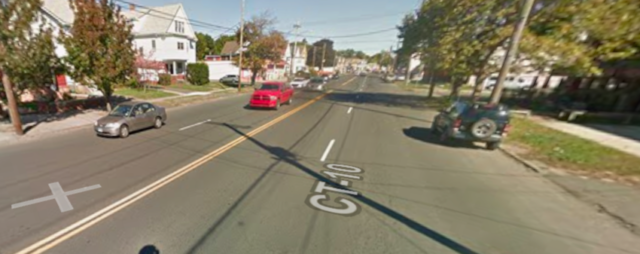
The absence of change is also obvious on Street View for Route 10 in Hamden. Looking at the site of a fatal pedestrian crash in December 2016 and March 2023, we can see that the roadway appeared this way in October 2016:
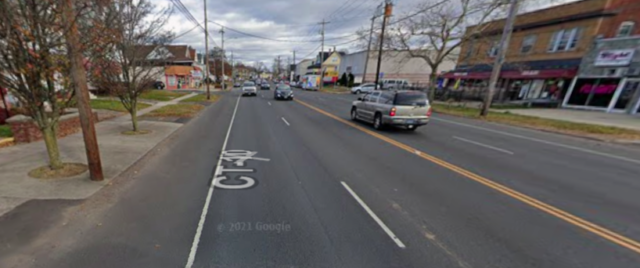
Here’s that same view in December 2021, five full years after the first fatal pedestrian collision in this spot:
You can see how Hamden’s ignore-it-and-it’ll-go-away approach to dealing with Route 10 is a problem by looking at a heat map:
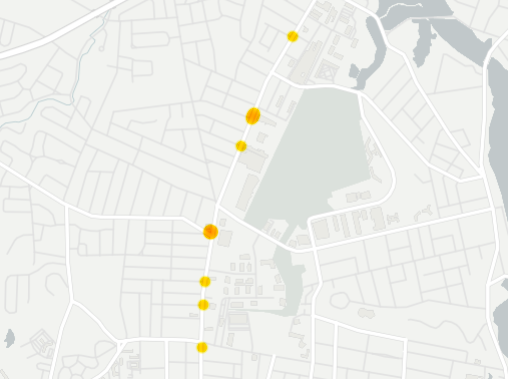
Those dots that look larger and orange? Those are where collisions were too close together to zoom in further, or where more than one pedestrian was killed in one crash.
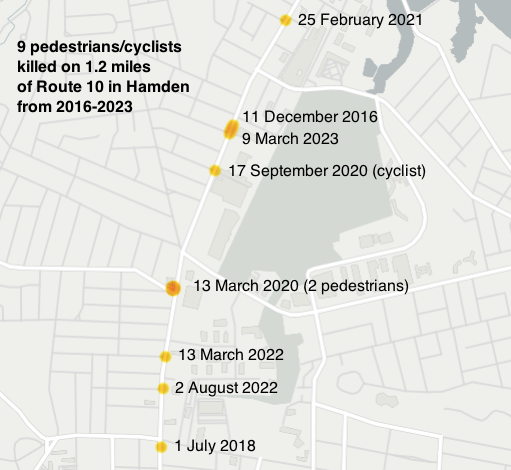
Here’s another way to look at this, and keep in mind that I did not include crashes in which drivers or passengers were killed, though there were several of these on Hamden’s section of Route 10:
Data itself is a story.
You can’t look at this data and believe everything is fine.
You can’t walk away truly believing that if only someone dressed like a disco ball and looked both ways eight times they would be alive today. Data shows us where people are getting killed over and over on the same roads, but also, it shows where people aren’t. If pedestrians were truly as reckless as some would have us believe, then statistically, these deaths would be spread out and occurring on every type of street. But pedestrians aren’t being killed in equal numbers everywhere — deaths on low speed, two-lane roads with sidewalks and appropriate pedestrian crossing infrastructure are the exception. When these occur, if you look at the crash details, it’s usually a scenario involving a large vehicle (low visibility) colliding with someone like a young child, an elderly person, or someone on the job, and these are happening in driveways and parking lots.
Occasionally, however, Street View shows us where a town has bothered to make even a small effort. Following the November 5, 2019 death of a high profile pedestrian — a Town Committee Chairperson — on Hartford Road in Manchester, one marked crosswalk and two hi-vis yield signs were added.
Here’s the location in July 2019, just four months before the crash — no crosswalk, no alert of intersection:
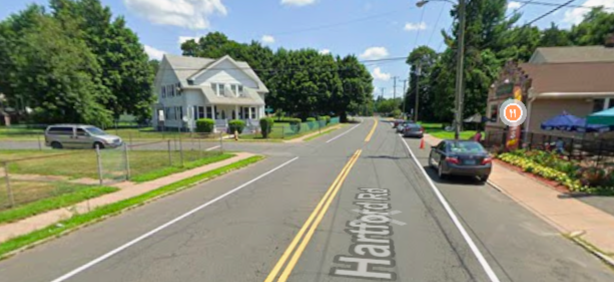
And here’s what Street View shows us the intersection looks like in November 2023:
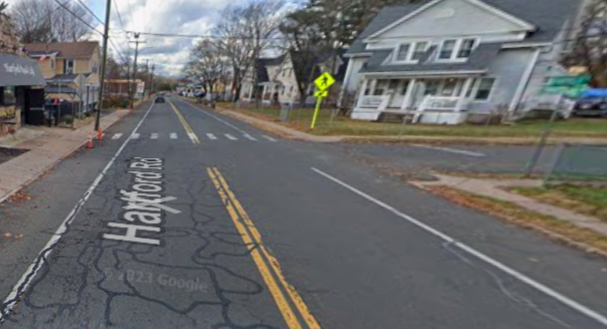
I wouldn’t go so far as to call that the gold standard of road design, but it shows minimal effort — something that unfortunately is not even present following most preventable serious and fatal pedestrian crashes.
The last observation I’ll leave you with is how data shows how exhaustingly many people are needlessly suffering. For this, let’s look at a single day: December 24, 2019.
When I asked the Crash Data Repository to show me all fatal crashes, this is what it revealed:
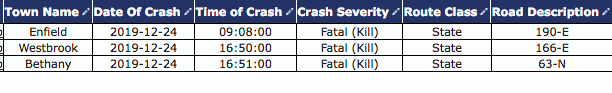 This only tells so much, though three separate deadly crashes on one day in a small state seems like a lot.
So, then I asked to see who was impacted. Were these multiple victims per collision? Single vehicle crashes? What?
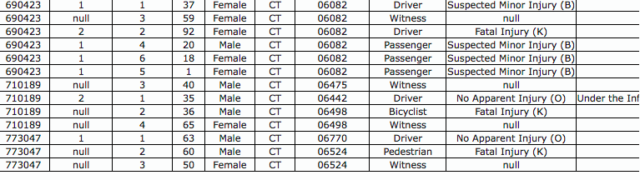 This shows more of who is impacted. One crash involving two drivers resulted in the death of one, but there were also three passengers who were likely traumatized by this, along with one witness. One of those passengers was an infant. In the second crash, two people were noted as witnesses in a hit-and-run in which a cyclist was killed by a driver who had been drinking at his landscaping job. The fatal pedestrian crash involved a driver, pedestrian, and a witness. This does not show every single person’s whole web of connections, but the pain only ripples out from here.
This is not a full picture, though, of one day on Connecticut’s roadways. . . so I asked to see how many crashes — motorists, pedestrians, cyclists, etc. — happened that resulted in any injury. There were 74 crashes of this type in one day: 71 with survivable injuries, 3 with fatal injuries.
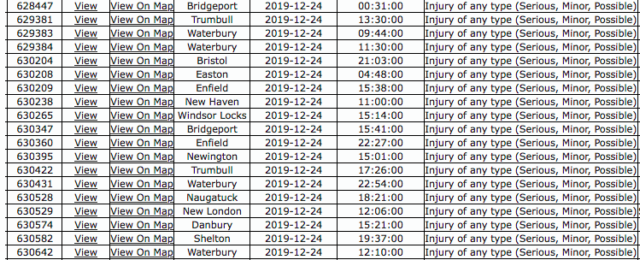
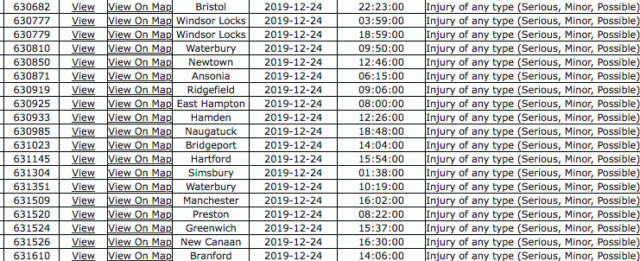
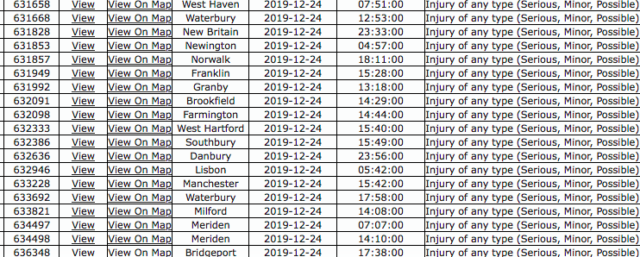
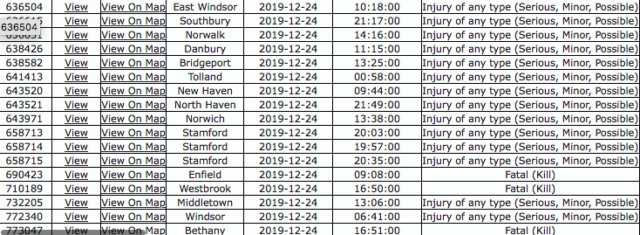
While I won’t provide the screenshots, when I asked about how many reported crashes happened, total, on December 24, 2019, the answer was 301.
One day:
301 total reported crashes
71 with survivable injuries
3 fatalities — one driver, one pedestrian, one cyclist.
The story that this data tells is one about us.
For too long, we have called these “accidents” and acted as if collateral damage were an acceptable compromise for unimpeded speed. It tells a story that began a century ago and implicates older generations, along with those holding positions of power now.
We have the power to change this story’s ending.
*I say it’s finished, but it’s not. I didn’t consistently add street and vehicle info to every death marker and would like to do this more extensively. The patterns are already apparent. Completing the data would simply serve to make an airtight case to shut up those who like to stew in useless arguments for things like individual responsibility and increasing traffic stops.

Safe Streets Connecticut: December 2023 – Real Hartford
[…] Do you want to be someone who punishes after the harm has been done? Or do you want to prevent that … […]